Time Series Analysis of temperature and rainfall of Bangladesh over 100 years.
- Md. Faruk Hasan
- Aug 14, 2017
- 3 min read
The world is getting warmer. Whether the cause is human activity or natural variability—and the preponderance of evidence says it’s humans—thermometer readings all around the world have risen steadily since the beginning of the Industrial Revolution. According to an ongoing temperature analysis conducted by scientists at NASA’s Goddard Institute for Space Studies (GISS), the average global temperature on Earth has increased by about 0.8° Celsius (1.4° Fahrenheit) since 1880. Two-thirds of the warming has occurred since 1975, at a rate of roughly 0.15-0.20°C per decade.
Bangladesh has a tropical monsoon climate with wide seasonal variations in rainfall, high temperatures and humidity. January is the coolest month with temperatures averaging near 26°C (78°F) and April the warmest with temperatures from 33 to 36°C (91 to 96°F). There are three distinct seasons in Bangladesh: a hot, humid summer from March to June; a cool, rainy monsoon season from June to October; and a cool, dry winter from October to March. The dry season runs from November to March. The monsoon has left the country during the month of October, but sometimes the rains can last until November, especially in the south-east, or when a late cyclone arrives. In general, however, November is hot, but not too much, with highs around 30°C(86°F), and sunny. The real winter begins in December, and is characterized by warm and sunny days, followed by cool nights. In the far north, in cities like Saidpur and Rangpur, in January, the coldest month, lows are around 11 °C (52 °F), and highs around 23 °C (73 °F). The climate is one of the wettest in the world. Most places receive more than 1,525 mm of rain a year, and areas near the hills receive 5,080 (mm). Most rains occur during the monsoon (June-September) and little in winter (November-February).
The aim is to represent the temperature and rainfall of Bangladesh and forecast the temperature.
Data and Methods
The temperature of Bangladesh by the period of 1901 to 2015 as well as the Rainfall in that same period is analyzed.
The trend stationarity of the data has to be checked by the Kwiatkowski–Phillips–Schmidt–Shin (KPSS) tests and unit root or a stationarity test by Augmented Dickey Fuller (ADF) tests. A time series plot will be constructed. The series will be decomposed and also be depersonalized. It will be decomposed again by simple moving average (SMA) method. The series will be forecasted by exponential and Holt-Winters Exponential Smoothing.
Results and Discussion
By checking the trend stationarity of the data by the KPSS test we got the following results.
KPSS Trend = 0.011554, Truncation lag parameter = 8, p-value = 0.1
Where the null hypothesis is that there is trend.
So there is a trend in the data because the p value 0.1 is greater than 0.05. So the null hypothesis is accepted.
The alternate hypothesis is that it is stationary and we get the results by ADF test
Dickey-Fuller = -5.5072, Lag order = 11, p-value = 0.01
alternative hypothesis: stationary
Now we get the summary of the data
Min. 1st Qu. Median Mean 3rd Qu. Max.
16.76 22.04 27.00 25.06 28.01 29.73
Time Series Plot of Temperature:

There is both Trend and Seasonal Component in the data.
Time Series Plot of Rainfall:

Autocovariance Function of Temperature:

Seasonal Values of temperature
Seasonal Values
January
-6.77844974
February
-4.50376064
March
-0.08992529
April
2.49269335
may
3.01883480
June
3.05914978
July
2.92603476
August
2.96903450
September
2.94548202
October
1.65895241
November
-1.95817646
December
-5.73986948
Seasonal Value Plot:

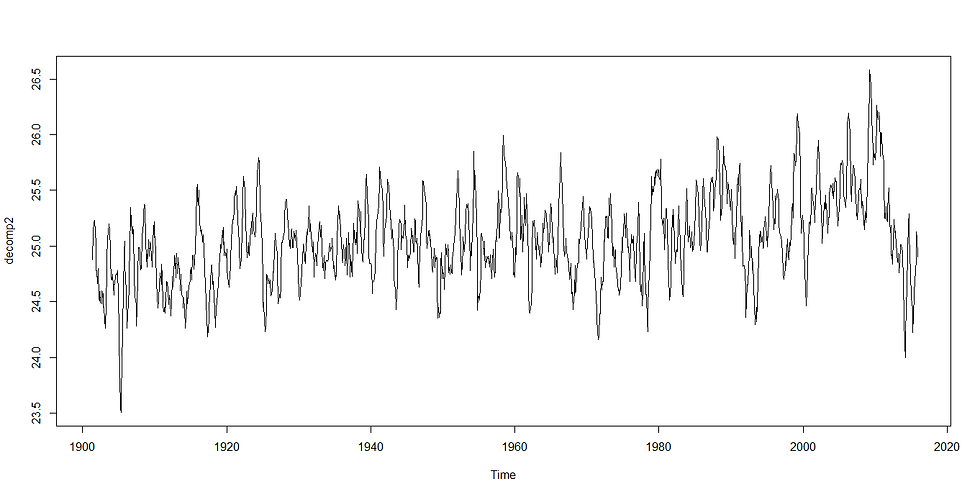
Decomposed Time series plot:

Deseasonalized:


Forecast:


We observed that only 38.1% spikes are significant. That is why Residual is not Stationary and model is not adequate.

Conclusion:
The temperature of Bangladesh by the period of 1901 to 2015 as well as the Rainfall in that same period is analyzed. We can get an overview of the temperature of Bangladesh by the analyzed data.
Reference:
*
Introduction to Time Series and Forecasting, Second Edition, Peter J. Brockwell Richard A. Davis.
*
http://sdwebx.worldbank.org/climateportal/index.cfm?page=country_historical_climate&ThisCCode=BGD


Comments